
Last year I did some stats about how many news stories are produced by hyperlocal websites. I used the as the listing source and then counted the stories pushed through the RSS feeds of the sites (there was also a degree of tortuous manual counting as well. The method is described in a research paper - PDF). The big headline from that research was there’s a hyperlocal story published once every two minutes (during the day).
In summer 2013 I revisited the database and applied the same method of counting. Here are the findings. Some of these (mainly the geographic spread stuff) will be published by Ofcom in a report on ‘Internet Citizens’ in the next few weeks.
List of main findings:
Sample
- The research draws on a list of 632 hyperlocal websites listed on the Openly Local database as of 7 June 2013.
- 496 of these sites were ‘active’ and operating in the UK. ‘Active’ was defined as a website having posted a news story at least once in the 5 months prior to the sample period or functioned as a forum-only or wiki-based website.
- 133 are no longer active. This figure is a mix of websites that have closed or have not published in the 5 months prior to the sample period.
- The research sampled the news stories published by ‘active’ websites from 18-28 June 2013 (11 days).
Publishing
- During the sampling period 3482 stories were produced by 224 sites (46% of ‘active sites). The number of stories produced in the 2012 sample was 3819 items by 313 sites.
- The average number of posts of those sites that published in the 2013 sample was 15.5 posts per site within the sample period (12.2 in 2012). The median number of posts of those sites that published was 6 (7 in 2012).
- 260 sites (54%) produced no story during the sample period (133 in 2012).
- 38 (8%) sites produced just one story (39 in 2012).
- 106 (22%) sites produced 5 or less items (133 in 2012). These were responsible for 8% of the posts (9.3% in 2012).
- 87% of news stories (58% in 2012) were produced by 20% of the sites.
Commentary: the lower number of published sites is largely down to a reduction in output from ‘Local People’ sites. These sites have undergone radical change in the last 12 months with the large network of journalists writing for them . The lower figure from these sites might also be accounted for in a refinement of the methodology, which attempted to avoid capturing adverts that were published in the news stream.
Frequency
- Overall, an average of 13 items per hour were produced by Hyperlocal websites (15 in 2012).
- During weekday daytimes this average rose to 22 items per hour (24 in 2012)
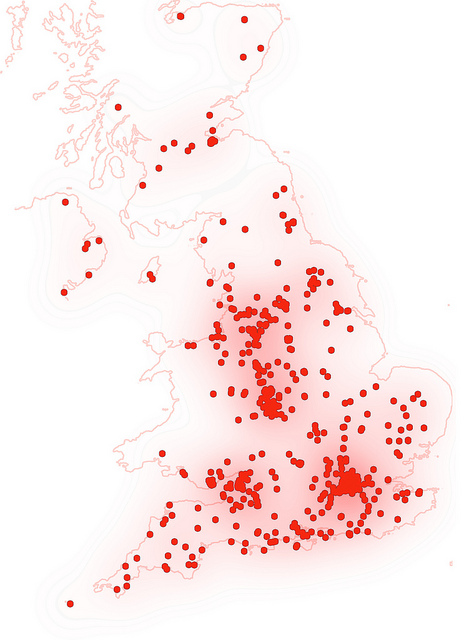
Geographic distribution
- Number of sites in UK nations:
England: 445 (+45 on 2012)
Wales: 26 (+11)
Scotland: 20 (+7)
Northern Ireland: 3 (no change)
- Number of sites in English regions:
London: 96
South West: 81
South East: 73
West Midlands: 59
Yorkshire and Humberside: 39
North West: 38
East Midlands: 16
East of England: 36
North East: 7
Birmingham has 26 active sites (-2 on 2012) – the most in any UK authority area.
(. This report builds on data from the 2012 report ‘‘)